July 25, 2022
Information on project storyboards.
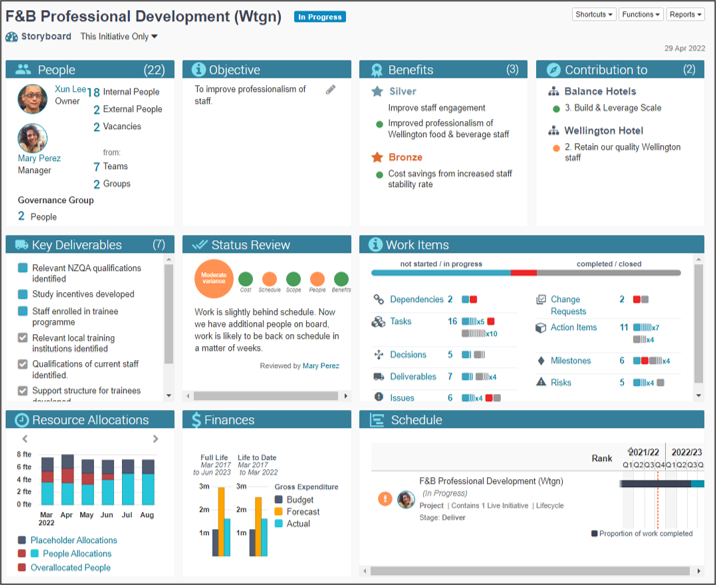
The project storyboard presents the current state of play. The storyboard bricks pull together key information to build an up-to-date picture of the project. Clicking on the title of a brick (eg People, Objective, Benefits), takes you to more detailed, related information. See below for information on each of the bricks.
People Brick
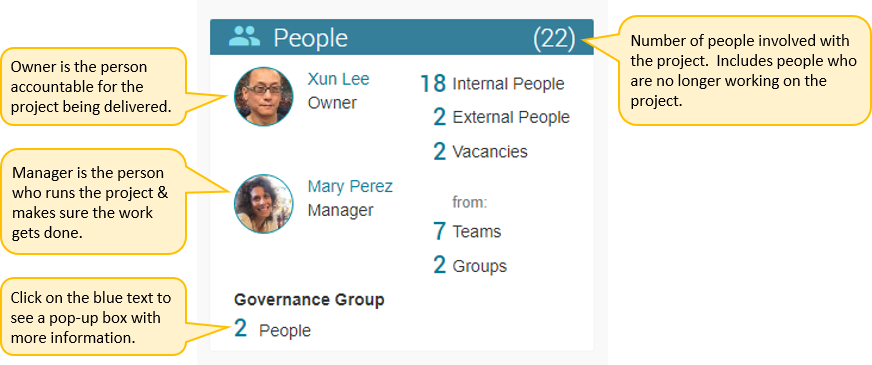
Shows you who’s leading the project and provides summary information about all those involved. Owner refers to the person who is accountable for the project being delivered successfully eg a Business Owner or Manager. Manager refers to the person who runs the project and makes sure the work gets done ie the Project Manager. Click here for more information on People.
Objective Brick
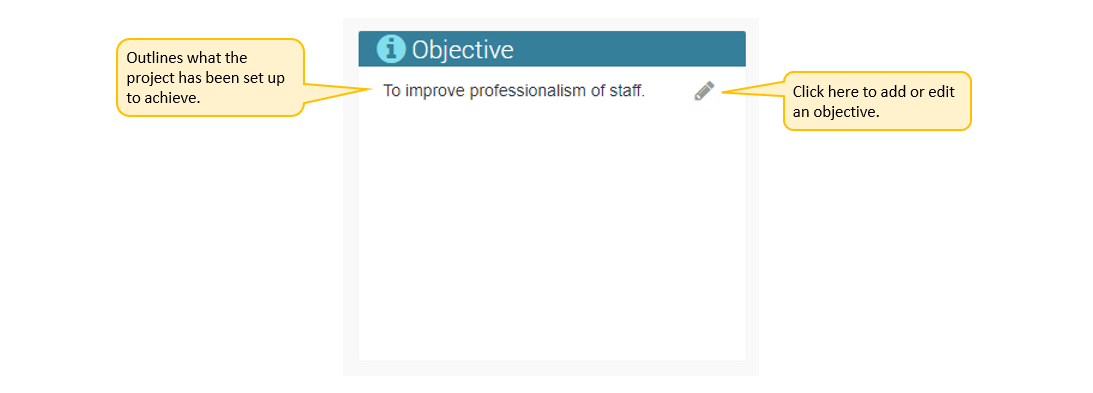
Outlines what the project has been set up to achieve. Note that this has a different focus from the project’s Description which is a more general summary of content of your project. For example, the Food & Beverage Professional Development Project has the following Objective and Description:
Objective: To improve professionalism of staff.
Description: Project to encourage Wellington based food & beverage staff to enrol in relevant NZQA qualifications. If successful then this work could be extended to other Wellington and Auckland based teams.
Click here for more information on how to add project Objectives.
Benefits Brick
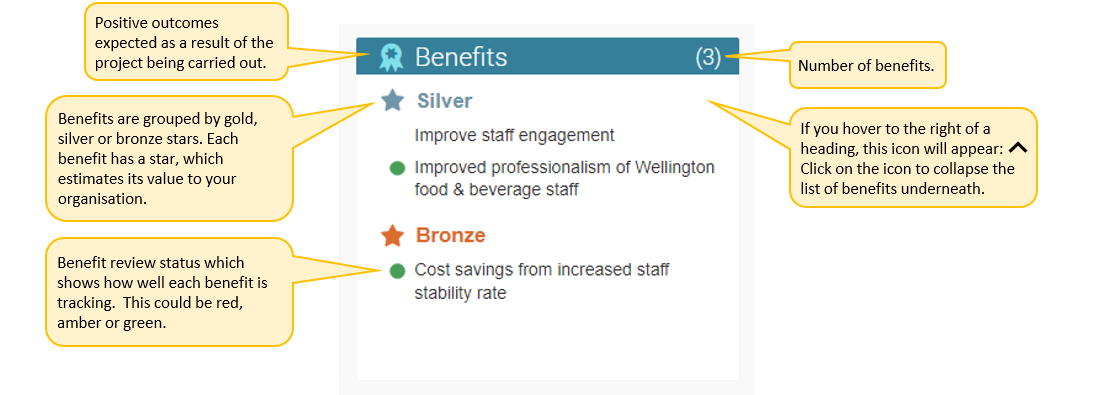
The positive outcomes expected as a result of the project being carried out. Each benefit is given a gold, silver or bronze star to estimate its value to your organisation. The coloured dot next to each benefit shows how well it is tracking at this point in time. The dot could be red, amber or green. Regular benefit reviews from the time the project starts, increase the likelihood benefits will be achieved. Click here for more information on Benefits.
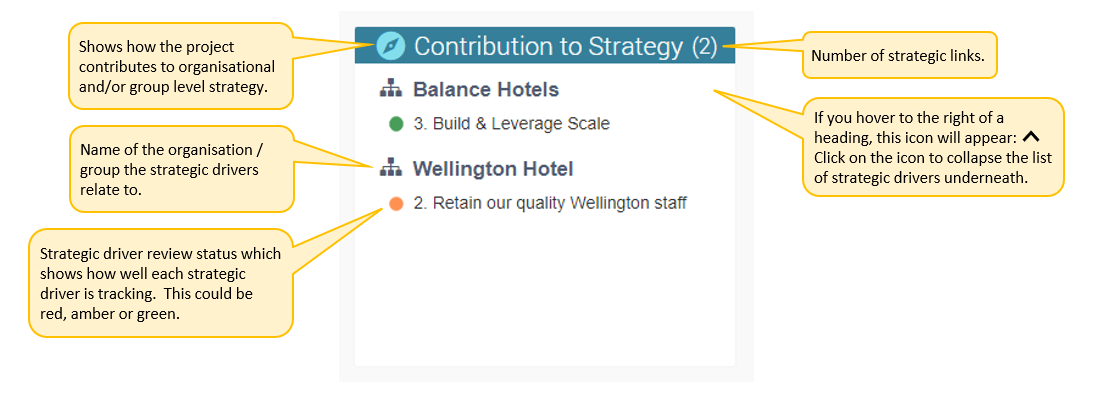
Contribution to Strategy Brick
Shows you how the project contributes to organisational and/or group level strategy. It identifies which strategic Drivers (key components of a strategy) the project contributes to. Click here for more information on Strategic Links.
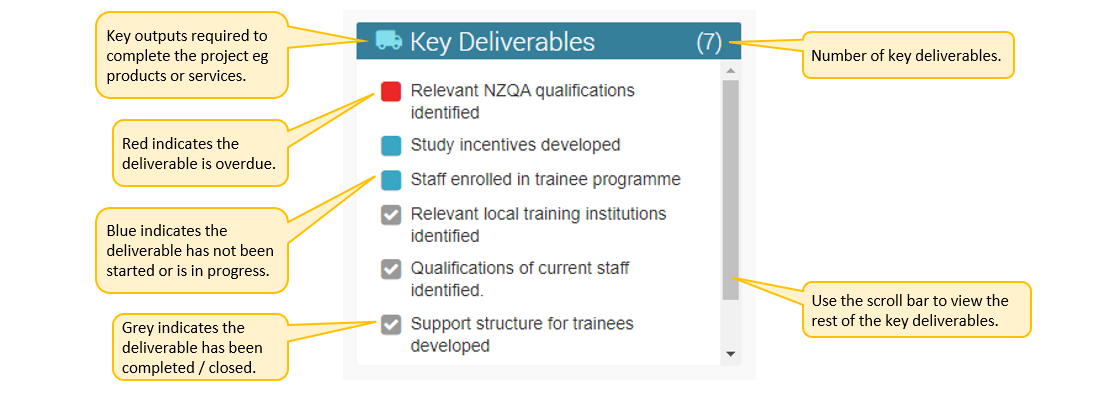
Key Deliverables Brick
Key outputs required to complete the project eg products or services. The coloured squares indicate the status of the deliverables. Blue indicates they are either Not Started or are in Progress. Red indicates they are Overdue and grey that they have been Completed/Closed. Note that only Key Deliverables are shown on this brick. To view all deliverables, navigate to the Deliverables tab. Click here for more information on Deliverables.
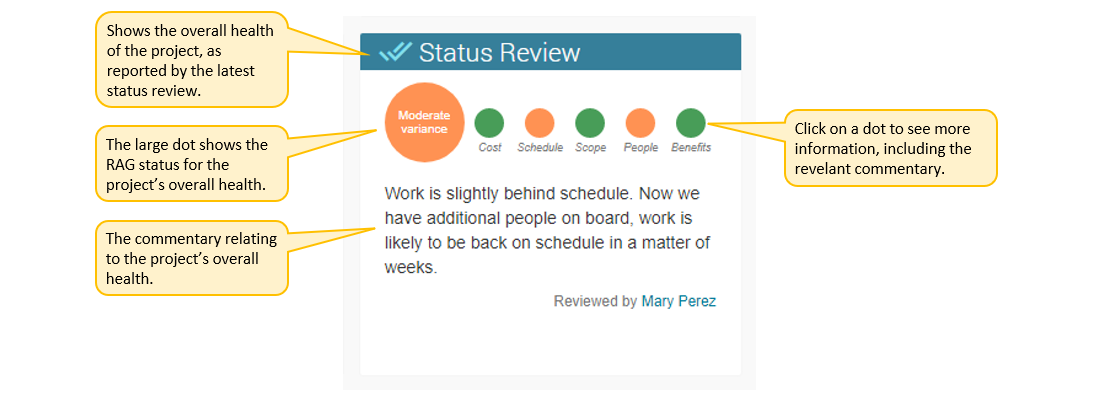
Status Review Brick
Shows the project’s latest Status Review. This reports on current status of the project: red, amber, green. It’s good practice for Managers to carry out these reviews regularly eg once a month or at the end of each sprint. Click here for more information on Status Reviews.
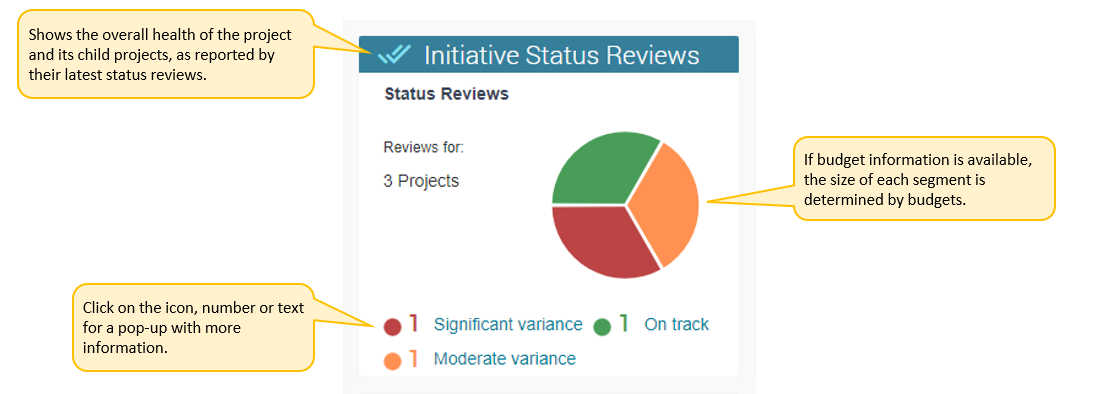
Initiative Status Reviews Brick (projects with child projects only)
Shows the overall health of the project and its child projects as reported by their latest status review. This information is presented in a pie chart.
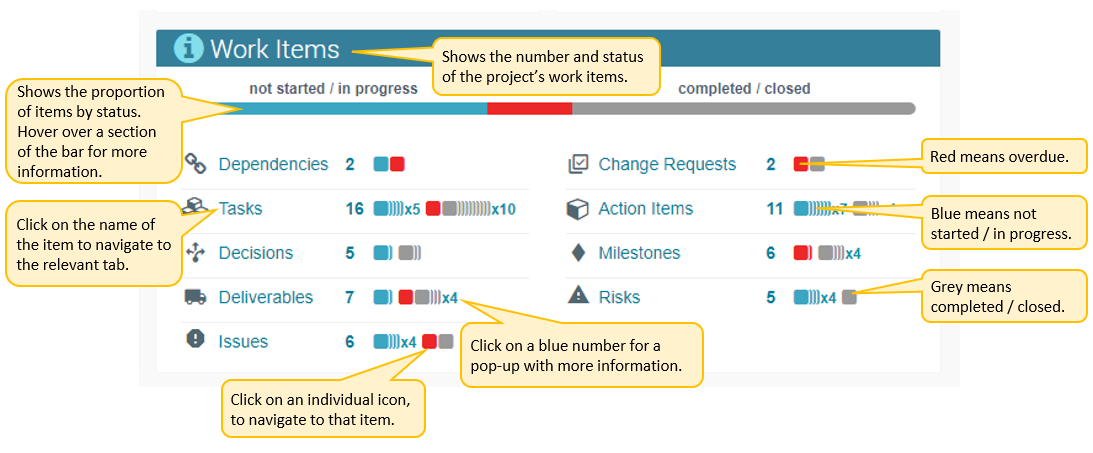
Work Items Brick
Shows you the number and status of the work items which make up the project. The coloured squares represent individual items and the colour indicates status. Blue indicates they are either Not Started or in Progress. Red indicates they are Overdue and grey that they have been Completed/Closed. See below for definitions of work items not already defined above:
Tasks: Timebound portions of work used to organise and schedule the work of your project. Task Pools are also included here.
Milestones: Define a significant point or event. They represent a moment in time so have no duration.
Dependencies: These can be incoming or outgoing. Incoming dependencies are tasks or milestones in other projects which need to be completed for your project to succeed. Outgoing dependencies are tasks or milestones in your project which another project is dependent on.
Risks: Uncertain events or conditions which, if they occur, could lead to undesirable consequences.
Issues: Events or conditions which have occurred and could lead to undesirable consequences.
Change Requests: Requests to make changes to the project which are outside the authority of the people managing or governing the initiative.
Decisions: Decisions which need to be made for the project to progress effectively. Excludes change requests which are managed separately.
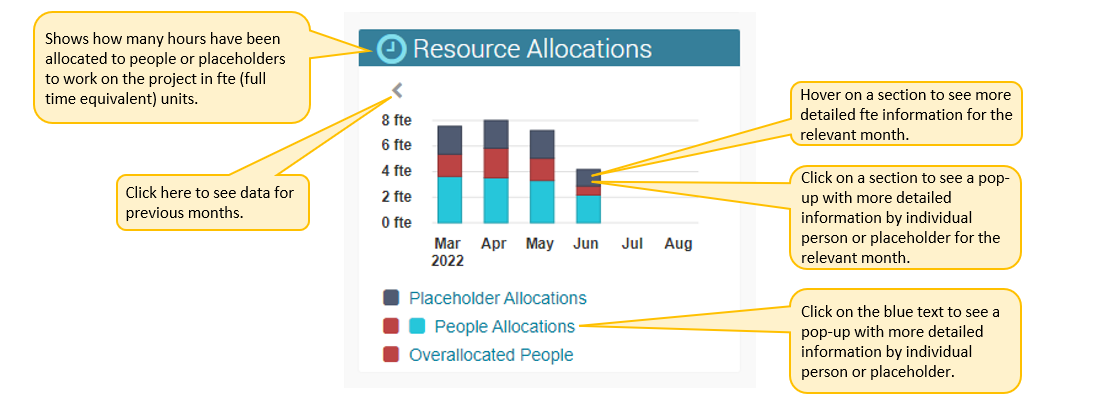
Resource Allocations Brick
This brick shows how many hours have been allocated to People or Placeholders to work on the project in fte (full time equivalent) units. 1 fte represents one full-time person. The red and blue sections of the column show the allocations to people, with the red section highlighting allocations to overallocated people. The dark blue section shows allocations to placeholders such as vacancies or positions, meaning that people still need to be identified to carry out these hours. In our application, hours are allocated to people and placeholders via Tasks / Task Pools.
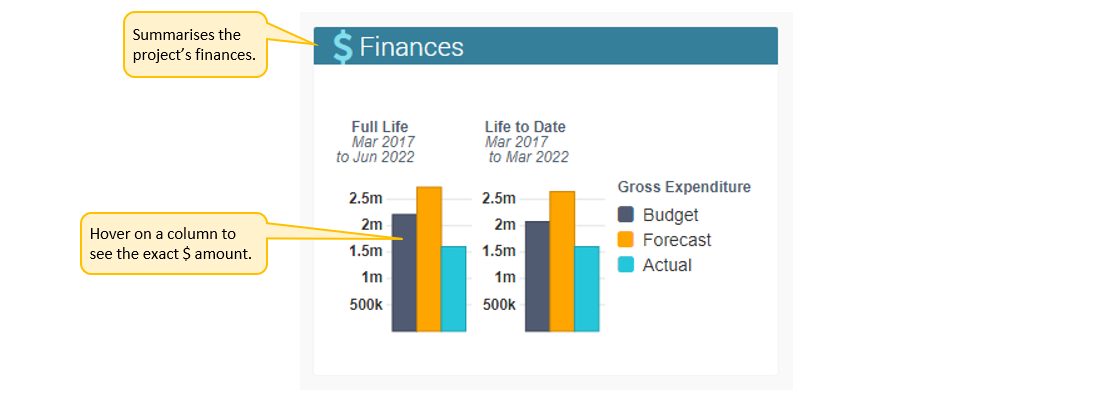
Finances Brick
Summarises the finances for the Project. The lefthand graph shows the Full Lifespan of the project, while the righthand one shows Life to Date figures. Click here for more information on managing Financial Information.
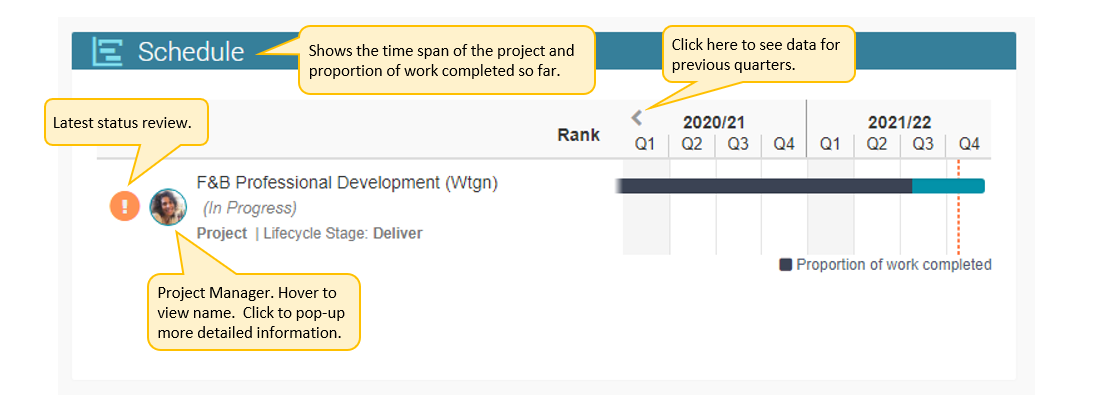
Schedule Brick
Shows you the time span of the project and proportion of work completed so far. It includes child projects which have this project as their direct parent. Click here for more information on the Schedule.
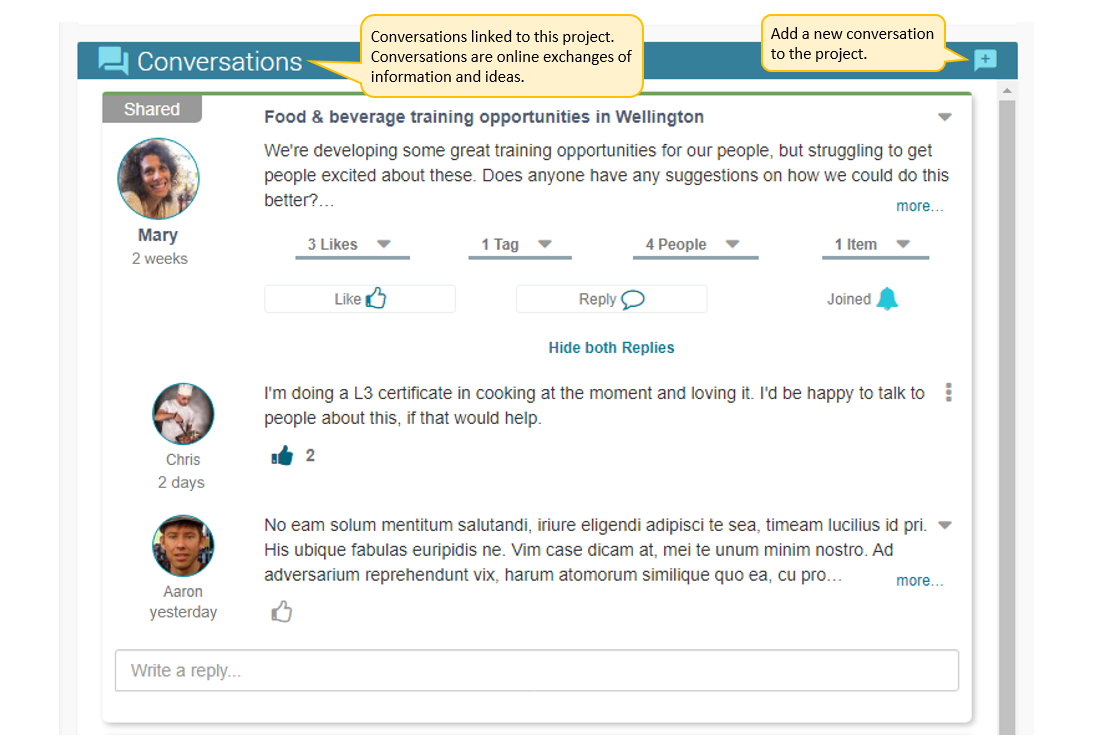
Conversations Brick
Scroll down to view the latest conversations linked to this project. Conversations are online exchanges of information and ideas and can be used in many ways throughout the system. Click here for more information on Conversations.
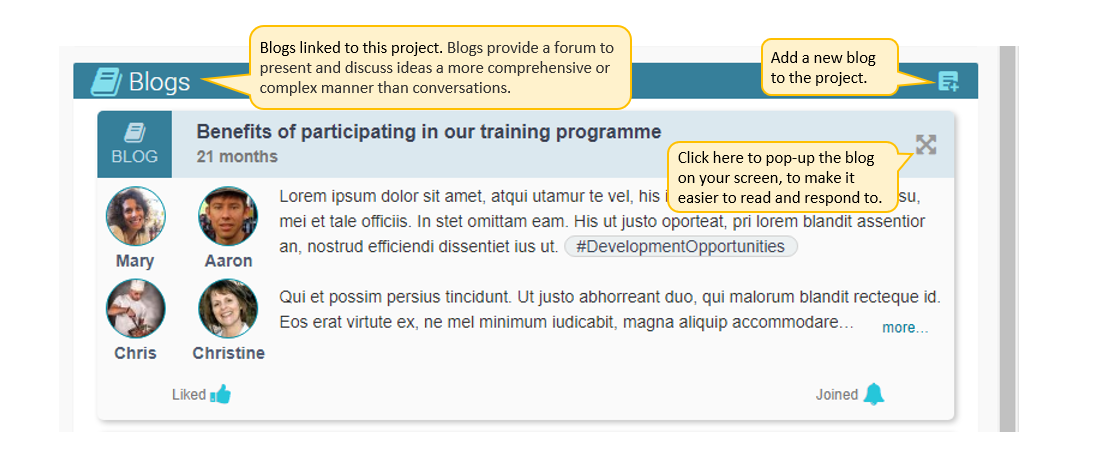
Blogs Brick
Scroll down to view the latest blogs linked to this project. Blogs provide a forum to present and discuss ideas in a more comprehensive or complex manner than conversations lend themselves to. Click here for more information on Blogs.
Primary Filter (projects with child projects only)
If your project has child projects, you can filter the storyboard by clicking on the text next to the Storyboard heading. You can limit your view to information directly related to this project, or you can include the project’s child projects. There are options to filter the information based on Initiative Status and Prioritisation. See below for more information.
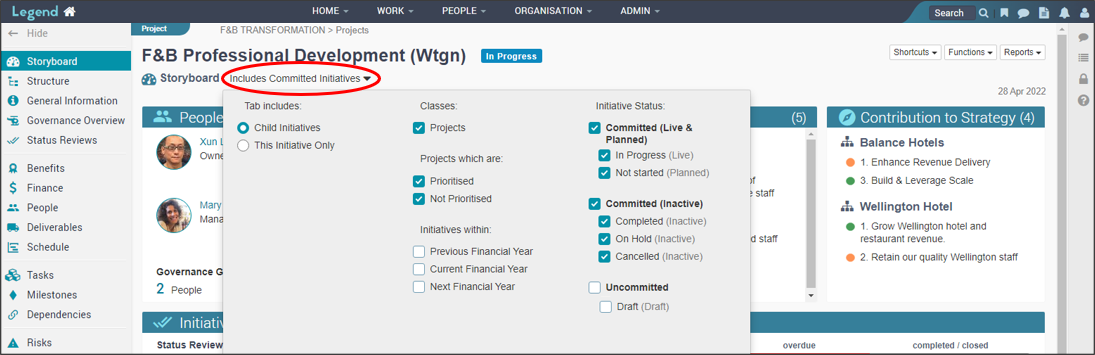
Initiative Status
Committed (Live & Planned): This includes status which your organisation has committed to delivering and are either live or planned. An example of a Committed Live status is In Progress. An example of a Committed Planned status is Not Started (Approved).
Committed (Inactive): This includes status which your organisation has committed to delivering and are inactive. An example of a Committed Inactive status is Completed.
Uncommitted: This includes status which your organisation has not yet committed to delivering. Examples of Uncommitted status are Cancelled (prior to start), Not Started (Unapproved) and Draft.
Prioritisation
For Projects you also have the ability to filter by prioritisation. For example you can just include those projects which are prioritised. Note that to show on the storyboard, projects would also need to have a status you have selected.