July 25, 2022
Information on how the application provides resource supply and demand information.
The application provides information about resource supply and demand at organisation and group level. You can also drill down to see supply and demand by team, initiative, position and individual. To view this information navigate to the organisation or relevant group.
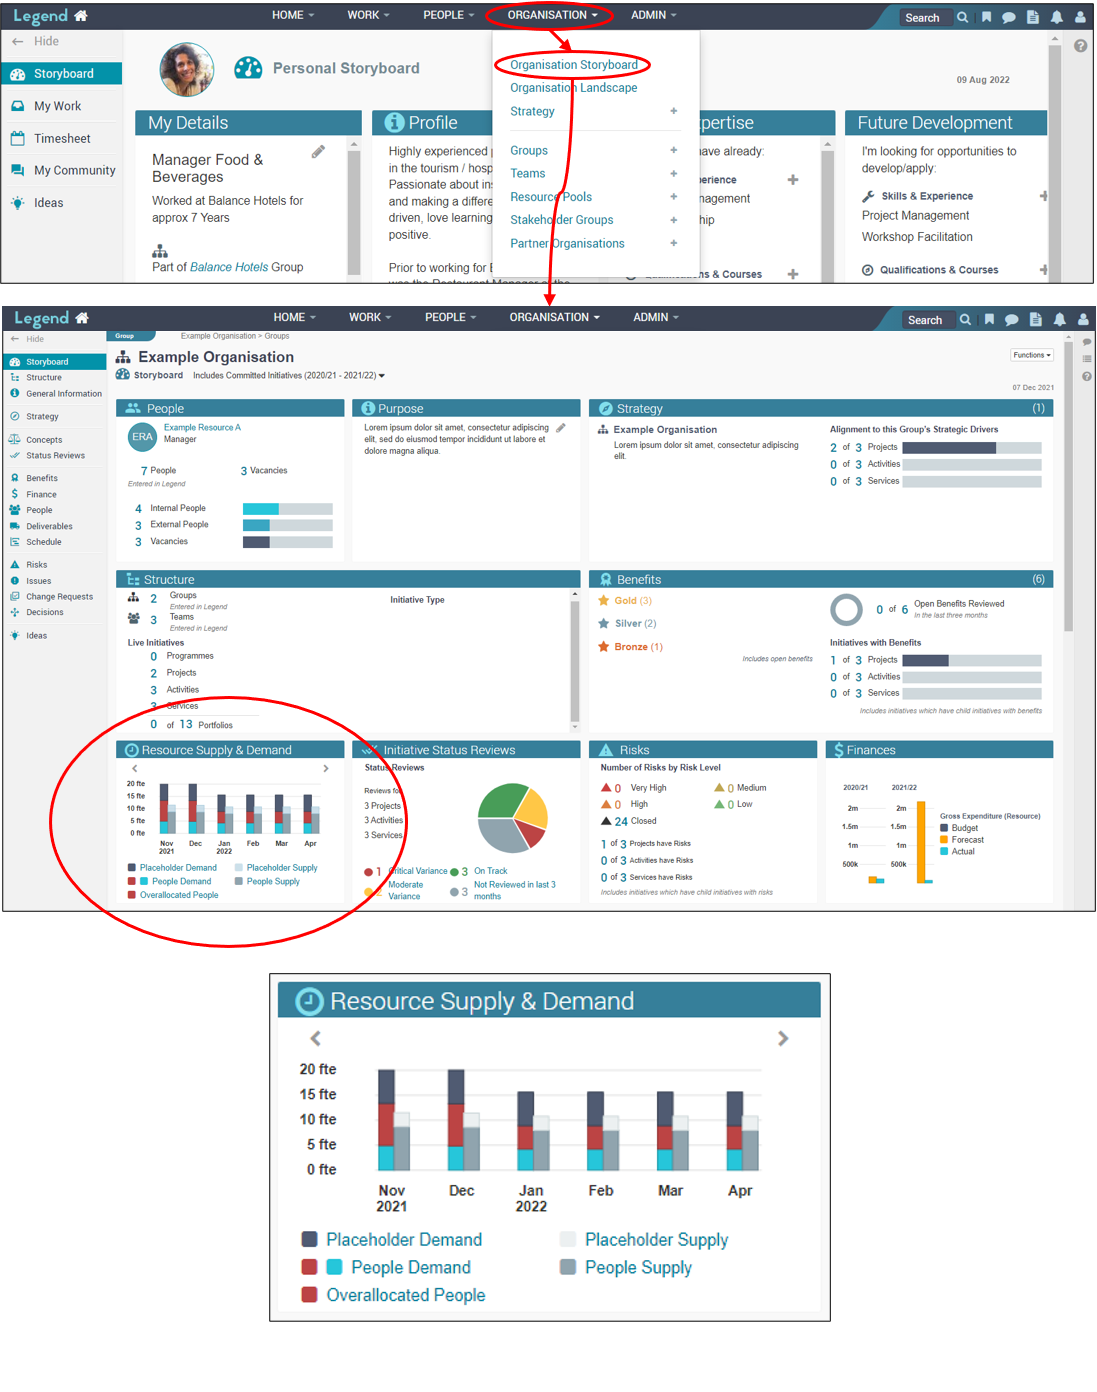
Organisation / Group Storyboard view
The ‘Resource Supply & Demand’ Storyboard brick gives you an overall monthly view in fte (full time equivalent) units. 1 fte represents one full-time person. For each month, the lefthand column shows resource demand and the righthand column shows resource supply.
Demand
Demand is calculated from the hours individual resources have been allocated to work on initiatives such as projects, programmes, activities and services. For example Joe Blogs may have been allocated 50% of his time to a project, 50% to an activity and 50% to a service, meaning his total allocation is 150%. Provided he works full time, this would equate to 1.5 fte on the demand column.
The red and blue sections of the demand column show the allocations to people, with the red section highlighting allocations to overallocated people. The dark blue section shows allocations to placeholders such as vacancies or positions. Managers can allocate vacancies or position placeholders to their initiative in the same way they can allocate actual people.
Supply
Supply is calculated from work hours for people such as internal staff and contractors. (Your organisation defines which resource types contribute to resourcing in Legend.) The dark grey section of the supply column shows the work hours for these people in fte.
You can also add vacancies into Legend. This enables you to see what impact filling vacancies would have on your resource supply. Vacancies can be entered by team managers or people with resource management permissions. The light grey section of the supply column shows the work hours for vacancies or other relevant placeholders. (Position placeholders are not included in this column as they don’t contribute to resource supply.)
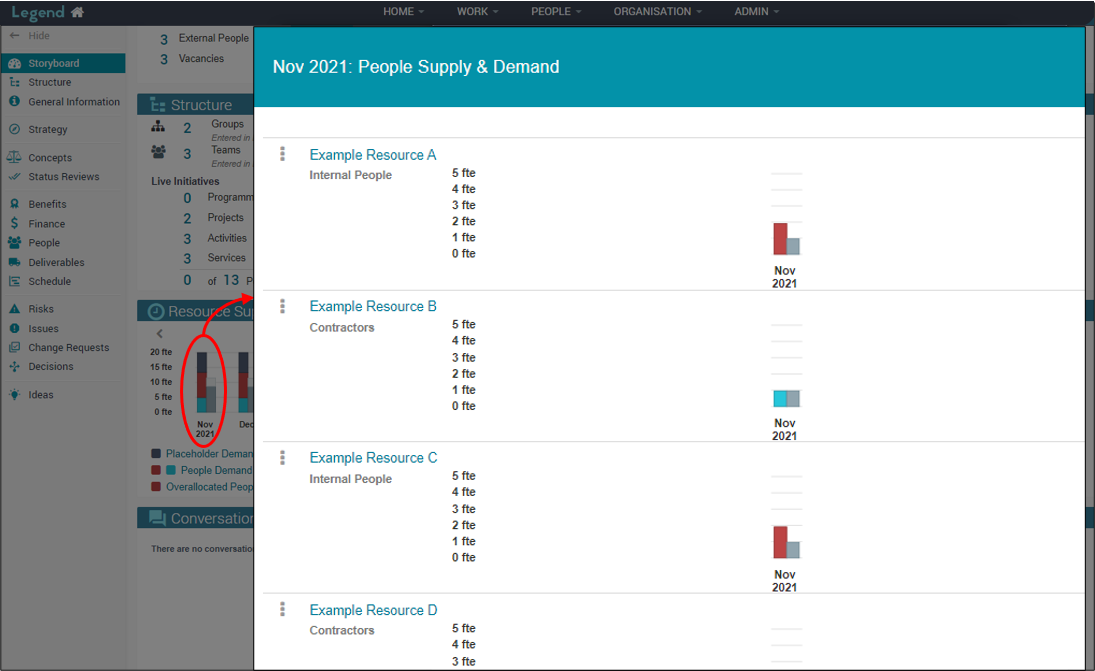
Hovering / clicking on the graph
You can hover on a section of the graph to see how many fte a particular section represents. Clicking on the columns will pop-up more detailed information on the relevant month, as the screenshot below shows.
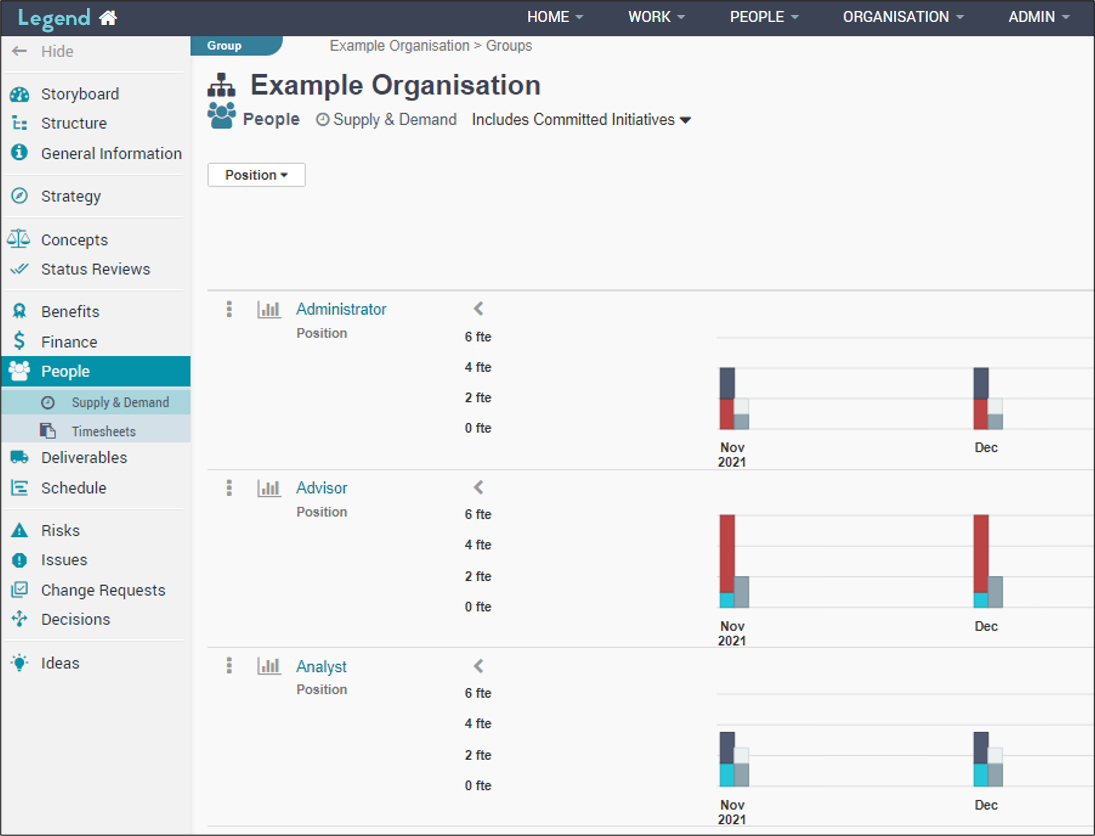
People tab
The organisation and other groups have more detailed resourcing information on the People tab. On the Supply & Demand view you have the option of seeing this information by Structure or by Position.
The Structure breaks down the supply and demand information further by group, team and initiative, as the screenshot below shows. You have the option of selecting just teams or initiatives.
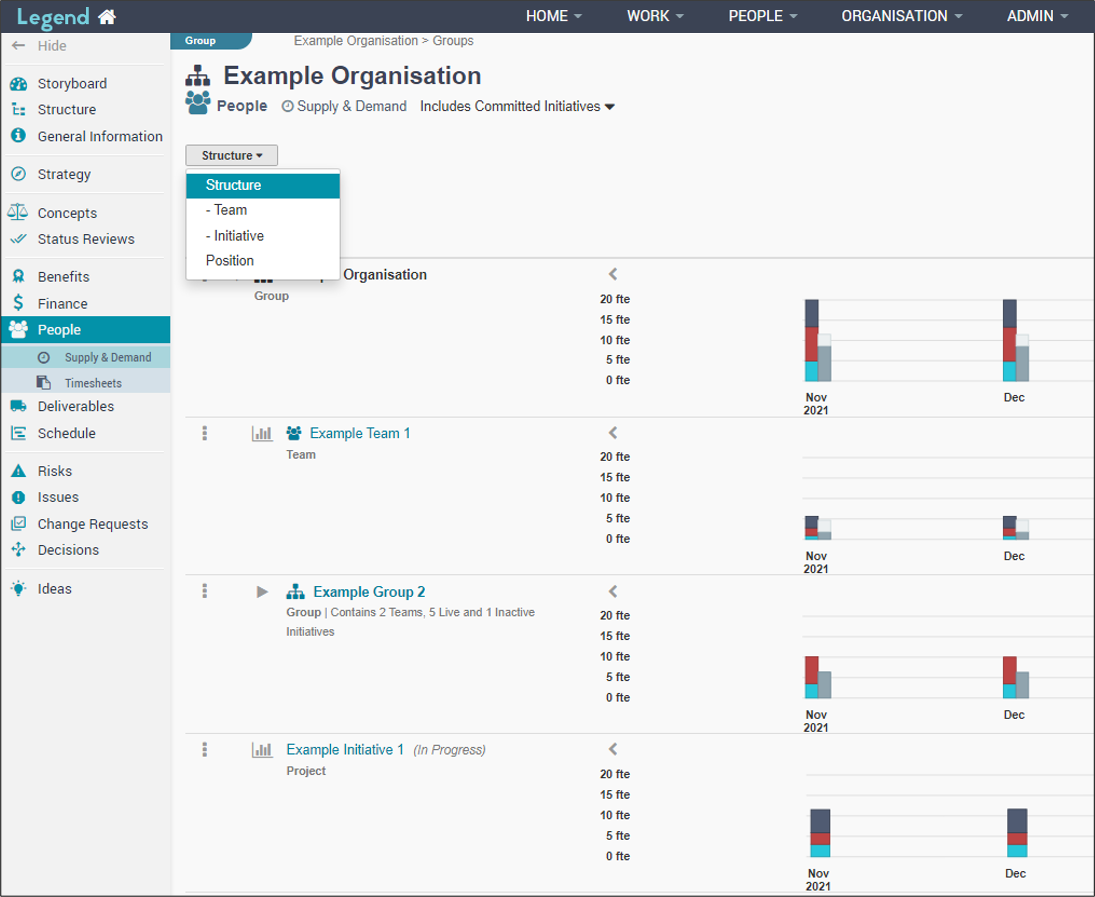
Click on a graph icon to the left of a heading to see a breakdown by individual resource.
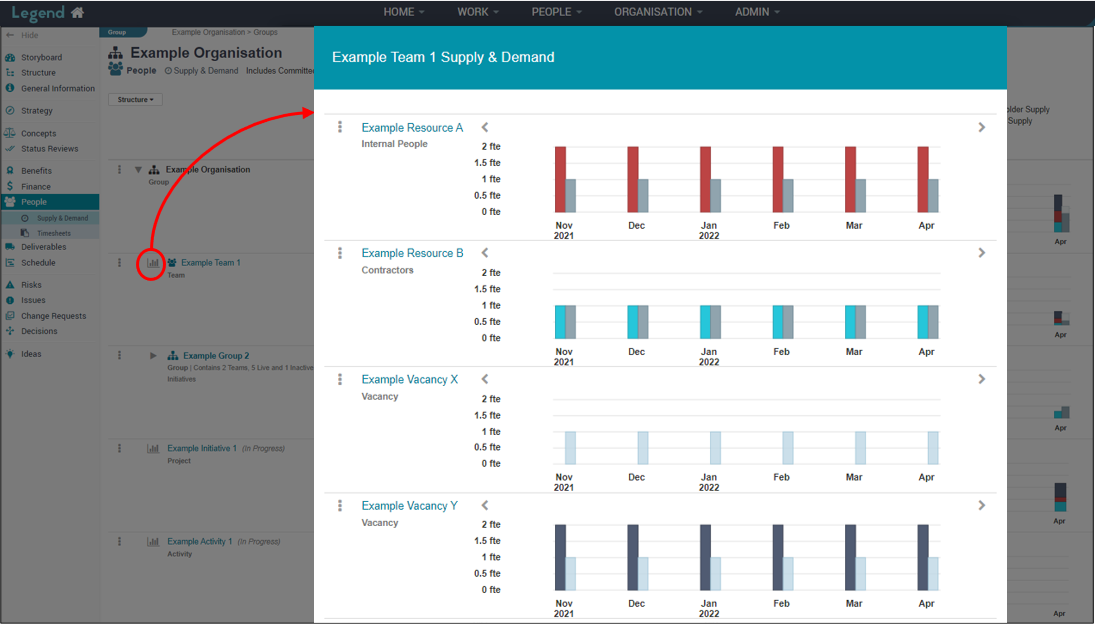
Click on the bars on the graphs on the righthand side of the screen to see more detailed monthly information
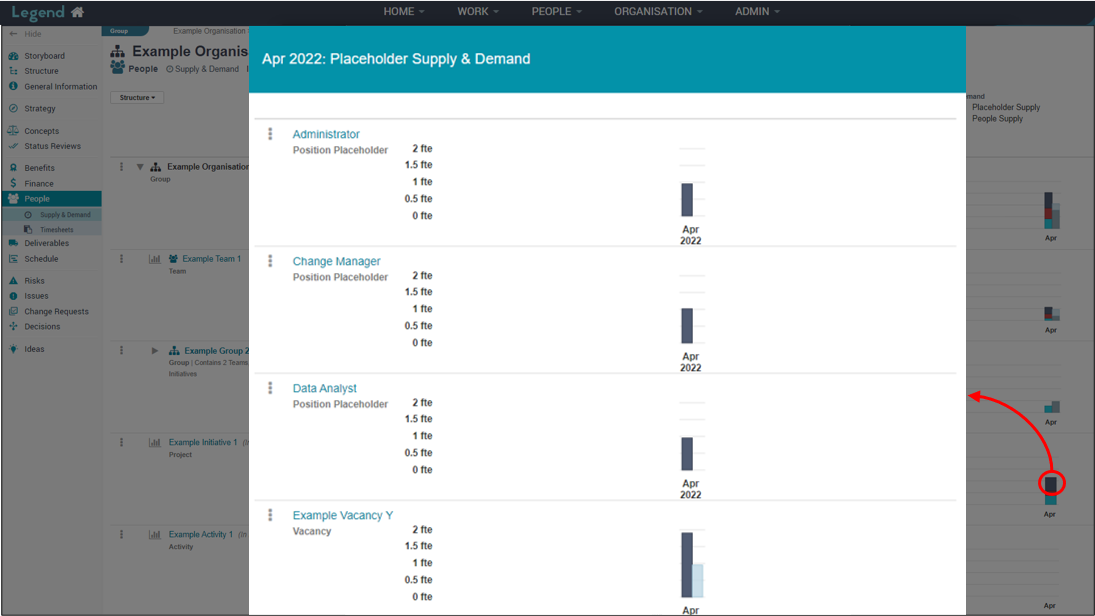
The Position view breaks down the Supply & Demand information by position, as the screenshot below shows.